 The Tableau Fellows, a cohort chosen from among NeighborWorks America's network organizations, work to tell new stories about their nonprofits through the information they collect, with the help of mentors, using Tableau, which helps organizations make the most use of their data through interactive data visualization software. NeighborWorks America's Tableau Fellows have always known that data tells a story. But the way data is presented has a direct impact on how compelling the story can be. That's why, through the fellowships, 15 staff members spent their time learning new ways to compile and present information to tell the stories of their organizations using the Tableau visual analytics platform. The staff members work at organizations throughout the NeighborWorks network in roles that range from communication and development to director of operations.
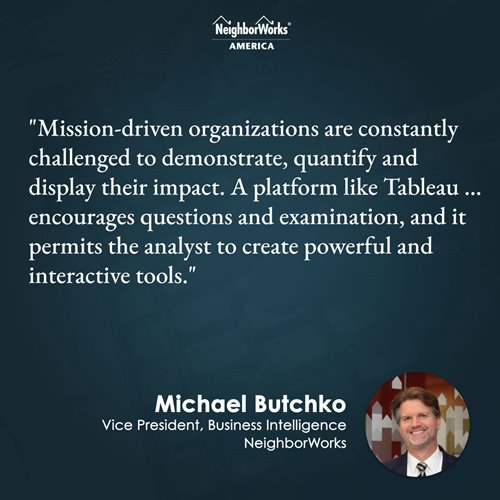
"Mission-driven organizations are constantly challenged to demonstrate, quantify and display their impact," explains Michael Butchko, NeighborWorks America's vice president of business intelligence. "A platform like Tableau encourages questions and examination and permits the analyst to create powerful and interactive tools that staff can use to understand their work better, the residents they serve, and the effectiveness of the programs they offer."
Jason Schumacher, senior social impact program manager for Tableau, says that often, analysts collect data from community members who never hear about it again. One goal of the Tableau software – and the Tableau fellows – is to make the data accessible. "They put the power to use data back in the community."
Tableau, the name for both the California technology firm and its tools, which help people see and understand data, began offering fellowship programs through its foundation in 2015 with organizations like Feeding America and Strive Together. They thought the model would work with NeighborWorks, which was looking to build more data. The first fellows became powerful advocates for data within their organizations and communities; the same is expected for NeighborWorks fellows. Through its partnership with NeighborWorks, the Tableau Foundation trains the fellows to analyze data around affordable housing efforts. This creates a crystallized view of which programs are most successful. The software allows network organizations to dig deeper into their information to assess reach and community impact.
Ashley Monson, social impact manager with Tableau, says this year's fellows found that going through the process made them think more about data collection, and about collecting the right data. One fellow used data to track and visualize milestones for her organization's strategic plan. Another used the software to visualize the impact of financial coaching.
Often, nonprofits talk about their impact through anecdotal stories. "But to really conceive of the problems at scale, you need data to tell those stories," Monson says. "Anecdotal stories humanize the experience, but you need data to go behind the policies and programs you're putting in place."
Data has its own potential to humanize stories as well, Schumacher adds, because it allows people to have conversations based on measurable realities before diving into individual situations.
The NeighborWorks cohort that worked together from 2020 to 2021 recently completed their fellowships, made possible through support from the Tableau Foundation. Over the year, they worked with two mentors: a technical volunteer mentor from Tableau, and a cultural from the NeighborWorks network who had been through the fellowship program. This was the second year of the program. Gains have already been significant.
As the fellows spend the next weeks sharing their stories with their organizations, board members and communities, some of the participants also shared their stories with NeighborWorks. The organization will begin accepting applications for the 2021 fellowship program on April 5. Applications close on April 30, and new fellows will be announced June 1.
How long people stay in one place
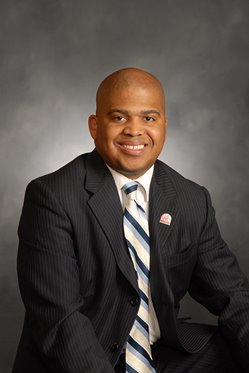
 In Palm Desert, California, Kenneth Rodgers, senior project manager for multi-family housing at Coachella Valley Housing Corporation, wanted to tell the story of the organization's properties. They own nearly 40, he says — some for that many years and some brand new. Rogers wanted to be able to tell how long residents stayed in the properties — if they stayed in a certain type of housing longer than another, for instance. And he wanted to differentiate between families, farmworkers, people with special needs, older Americans and veterans.
The story his data told was that at one particular type of property, residents stayed an average of 16 years. At other properties, the average was eight years. Why the difference?
Rodgers discovered that the four properties where the residents stayed the longest had the feel of a single-family home — even though they were, in fact, part of a multifamily unit. "People stayed in places longer where it felt like a house," he says. Units occupied by farmworkers also seemed to have a longer history. Those units are older, he says, and the people who occupy them are older, too.
He also crunched numbers of rent versus subsidy, he says, and learned that residents in the family units spent a lot of their own money on rent. Even individuals who received larger subsidies spent a lot out of pocket, he says. The numbers buck the stereotype about people who live in affordable housing. He learned that families receiving subsidies still paid an average of $620 in rent. Veterans paid $269. Individuals with special needs paid $456 toward their rent, while seniors paid an average of $448. Farmworkers, he learned, paid an average of $457.
Rodgers says he's been collecting data for a long time. The fellowship allowed him to aggregate it and pull out what was important. "We were able to pull out a picture and tell a great story with information we already had at our fingertips," he says. The fellowship allowed him to not only visualize the work, but to see more clearly the people his organization was doing the work for. "A lot of our work is for farmworkers," he says. "To see how much they are putting in of their own money was eye-opening. It resolidified why we do the work we do."
The data will be used in more public storytelling, he says, to help explain to bankers, politicians, and other housing advocates what the organization does and how they're doing it. "My wish, my real wish, is for the whole agency to be data driven," he says.
A map of impact in Baltimore
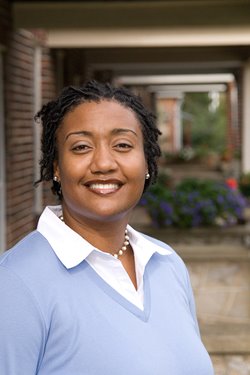
 Johnette Richardson created a dashboard to highlight production outcomes in the various program areas at NHS Baltimore. "I started off the year wanting to know where, in Baltimore, we'd had an impact," she says. "I knew I wanted a map. I wanted to know where we'd helped people buy homes, where we'd removed barriers, where we'd helped with savings, where we'd helped with credit debt."
While she knew some of the data points independently — the number of people who had gone through their counseling program (1,668) and the number of loans they'd put out (559 loans, deploying $7 million) she wanted to look at the bigger picture.
During the fellowship, Richardson met with her two mentors, a cultural mentor and a technical mentor, and established her points of focus. "I knew where I needed to be with the data and I wanted to have clean data. With our information, there were so many hands touching it before it got to me that it wasn't always the right information," she says. So, her first task was getting trusted data.
She drew out what she wanted, first by pencil, then using the software, as she worked to capture her data. When she showed the staff her final project, she says, they were each able to see their part in the impact the organization had on Baltimore. That made them talk more about the stories behind the data. "Storytelling is a big part of the numbers we shared," Richardson says.
Homeownership preservation is one of NHS Baltimore's key programs — providing small grants or loans to help families with home repairs. One rehab specialist looked at the map and told the story of an older resident who hadn't had heat for 10 years. But through NHS, she was finally able to get heat. Retelling the story during a recent ice storm, Richardson says, helped punctuate the importance of the work the organization does.
"Sometimes we get lost in just doing our jobs every day," Richardson says. "We don't see how the collective work impacts the city of Baltimore. But using this data, especially during this time of COVID, to see the impact has been a real motivating factor for the staff. They're able to see themselves in the data, and to see their collective impact in Baltimore."
The data, she says, helps the staff explain why they do what they do; it helps show social and economic justice in action. "When you see that belief in action — the work all of us have done together – it reaffirms that we're living out our goals as an organization."
Looking at liens in Chicago
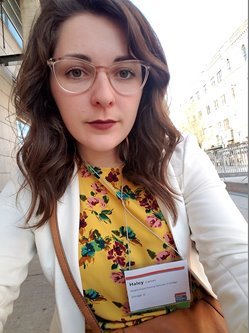
 Haley Cannon, program associate in property preservation for Neighborhood Housing Services Redevelopment Corporation in Chicago, says the first thing the fellowship taught her was about data quality. "Garbage in, garbage out," was a saying she already knew, she says. But as she began answering questions and looking at historical data for the map she was putting together, that saying was confirmed. So last summer, she went out to get more data herself, driving from empty building to empty building in Chicago.
Cannon's organization is a delegate of Chicago's Troubled Buildings Initiative. "At NHS, we support comprehensive community revitalization, and this takes many forms" Cannon says.
The organization works with partners to acquire liens so they can get properties "unstuck" and ready to be rehabbed, placed back on the market, and reoccupied. It's part of the organization's work in stabilizing communities. The new map will serve as a tool so developers and investors who want to acquire vacant properties can see where they are and learn about them.
"People come to us seeking information about the program. Sometimes, they aren't even sure what they are looking for." Cannon says. "Now we have a map where they can see where we're doing the work. People can make the connections."
But first, she had to make sure she had the right data, with no gaps. "My team and I must have driven around and looked at 400 properties to clean that data," she says.
Cannon's project is on the Tableau website and will soon be on NHS's website as well. "We want to use our liens as a way to get property into the hands of someone who will rehab and reoccupy," she says. "We want to sell these buildings to someone who will live in them." Before the map, she says, her organization would send interested investors a variety of spread sheets. "This is a much more digestible format," she says. "It's a map of Chicago."

